")
Through the investigation of tourist spots, tourist routes and tourist areas at different levels, form photos and video data of tourism resources, tourism services and tourism facilities of scenic spots, scenic spots, corridors and important tourism transportation nodes, tourism villages and tourism towns, record the tourism development status, find problems in tourism development, and form corresponding ideas for the construction of world tourism destinations; The data sources are UAV, tachograph and camera, mobile phone and GPS, and are divided into different folders according to scenic spots and data categories; The data has been checked for many times to ensure its authenticity; This data can provide a traceable basis for the construction of world tourism destinations on the Qinghai Tibet Plateau.
SHI Shanshan
")
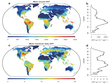
Based on the distribution locations of the Qinghai toad-headed lizard (Phrynocephalus vlangalii) collected by field investigation and literature investigation, combined with five climate factors from WorldClim database, the current (1960-1990) and future (2061-2080) climate data were input into the trained species distribution model to predict the current and future suitable habitats. The prediction results shows that the lizard will lose a lot of original habitats under the climate change, and the protection measures for the lizard species should focus on the eastern margin of Qinghai-Tibet Plateau, the northern and eastern parts of Qaidam Basin. The model also predicts that after the climate change, new suitable habitats will appear in areas that were not suitable for the Qinghai toad-headed lizard. However, due to the very limited diffusion ability of reptiles (the maximum annual diffusion distance recorded in the literature is less than 500m), the newly emerging suitable habitats may not be used by the Qinghai toad-headed lizard. Meanwhile, based on the physiological, life history, behavior and morphological data of three altitudinal populations of the Qinghai toad-headed lizard collected by field work, and combined with microclimate data, the physiological consequences of climate change on the Qinghai toad-headed lizard in the current suitable distribution area were predicted by using the mechanism niche model. The prediction results of the model show that, whether in the SSP245 or SSP585 climate change scenarios, the activity time of the lizard will increase in most areas (> 93%) of the current suitable distribution area, and the thermal safety threshold will decrease in all places of the current suitable distribution area. The increase of activity time of high-altitude populations is less than that of low-altitude populations, but the decrease of thermal safety threshold is greater than that of low-altitude populations. The results reveal that climate change may have a greater impact on lizard populations in high altitude areas.
ZENG Zhigao
")
This data set records the simulation area of vegetation restoration and reconstruction technology of sandy land (Ningxia / Zhongwei / Shapotou) meteorological elements and three parameter data of soil at different depths from January 2021 to December 2021, and in order to explore the feasibility of high salinity salt water in the Aral Sea for vegetation construction, the project members carried out salt water irrigation and planting Suaeda salsa in saline alkali lands such as No. 2 company, regiment 31, second agricultural division, ganquanpu, Karamay, Luntai and tumushuk in the lower reaches of Tarim River, Xinjiang from 2020 to 2021 To study the phenotypic characteristics of different plants under high salinity saline water irrigation. The collected data include soil physical and chemical properties such as soil water content, electrical conductivity and soil salt, as well as physiological data of salt tolerant plants.
LI Xinrong, HE Mingzhu, ZHAO Zhenyong

1) Data content: the data are the ancient DNA data generated by studying the cultural layer of Klu lding site in Nyingchi region, Tibetan Plateau, including the hiseqx metagenomics data of 10 ancient DNA samples from 4 layers. It can be used to preliminarily analyze the changes of species composition recorded by ancient DNA in the sediments, and reveal the process of local agricultural development. 2) Data source and processing method: the research group has its ownership. the data were obtained by using pair-end library building and Illumina hiseqx sequencing platform. 3) Data quality: 20.3 MB, Q30 > 85%. 4) Application: The data will be used to explore the potential of the ancient DNA from archaeological sediments in revealing the development of ancient agriculture on the Tibetan Plateau.
YANG Xiaoyan
")
This vegetation water content data set is derived from the ground synchronous observation in the Luanhe River Basin soil moisture remote sensing experiment, including 55 sampled plots.The vegetation types involved in these sampled plots include grass, corn, potatoes, naked oats and carrots. The data measurement time is from September 13, 2018 to September 26, 2018.
ZHENG Xingming, JIANG Tao
 dataset of Tibetan Plateau (1980-2018)")
The data set is based on the GPP simulated by 16 dynamic global vegetation models (TRENDY v8) under S2 Scenario (CO2+Climate) and represents the gross primary productivity of the ecosystem. Data was derived from Le Qu é r é Et al. (2019). The range of source data is global, and the Qinghai Tibet plateau region is selected in this data set. Original data is interpolated into 0.5*0.5 degree by the nearest neighbor method in space, and the original monthly scale is maintained in time. The data set is the standard model output data, which is often used to evaluate the temporal and spatial patterns of gross primary productivity, and compared with other remote sensing observations, flux observations and other data.
STEPHEN Sitch

Grassland actual net primary production (NPPa) was calculated by CASA model. CASA model was calculated with the combination of satellite-observed NDVI and climate (e.g. temperature, precipitation and radiation) as the driving factors, and other factors, such as land-use change and human harvest from plant material, were reflected by the changes of NDVI. CASA NPP was determined by two variables, absorbed photosynthetically active radiation’ (APAR) and the light-use efficiency (LUE). Grassland potential net primary production (NPPp) was calculated by TEM model. TEM is one of process-based ecosystem model, which was driven by spatially referenced information on vegetation type, climate, elevation, soils, and water availability to calculate the monthly carbon and nitrogen fluxes and pool sizes of terrestrial ecosystems. TEM can be only applied in mature and undisturbed ecosystem without take the effects of land use into consideration due to it was used to make equilibrium predications. Grassland potential aboveground biomass (AGBp) was estimated by random forest (RF) algorithm, using 345 AGB observation data in fenced grasslands and their corresponding climate data, soil data, and topographical data.
NIU Ben, ZHANG Xianzhou
")
Gwadar deep water port is located in the south of Gwadar city in the southwest of Balochistan province, Pakistan. It is 460km away from Karachi in the East and 120km away from Pakistan Iran border in the West. It is adjacent to the Arabian Sea in the Indian Ocean in the South and the Strait of Hormuz and Red Sea in the West. It is a port with strategic position far away from Muscat, capital of Oman. This data is the land cover data of Gwadar and its surrounding areas. The data is from globeland30 with a spatial resolution of 30 meters and a data format of TIFF. The classification images used in the development of globeland30 data set mainly include Landsat's TM5, ETM +, oli multispectral images and HJ-1 multispectral images. Using the Pok based classification method, the total volume accuracy is 83.50%, and the kappa coefficient is 0.78.
WU Hua
")
1) Data content: the main ecological environment data retrieved from remote sensing in Pan third polar region, including PM2.5 concentration, forest coverage, Evi, land cover, and CO2; 2) data source and processing method: PM2.5 is from the atmospheric composition analysis group web site at Dalhousie University, and the forest coverage data is from MODIS Vegetation continuum Fields (VCF), CO2 data from ODIAC fossil fuel emission dataset, EVI data from MODIS vehicle index products, and land cover data from ESA CCI land cover. 65 pan third pole countries and regions are extracted, and others are not processed; 3) data quality description: the data time series from 2000 to 2015 is good; 4) data application achievements and prospects: it can be used for the analysis of ecological environment change.
LI Guangdong
")
This dataset records The experiment of soil water content in the lower reaches of the Tarim River (Karl) was carried out by the members of the Xinjiang salt water Regiment (Karl) from September to September, 2020 In order to study the phenotypic characteristics of different plants under high salinity saline water irrigation, and to explore the feasibility of high salinity saline water for vegetation construction.
LI Xinrong, HE Mingzhu, ZHAO Zhenyong

In order to analyze how and when vines entered the Qinghai Tibet Plateau, and to explore the relationship between the spread and domestication of vines on the Qinghai Tibet Plateau and the plateau settlement and ancient Silk exchanges of early human activities, the research team conducted genome sequencing and de sequencing of the whole genome of self bred F1 varieties of Brassica rapa in Nangqian County of Qinghai Province in June 2018 The size of the assembled genome was 409.69 MB and contig N50 was 1.21 MB. This result can provide a genetic basis for studying the relationship between plant dispersal and human activities. At the same time, this study will help to reveal the effects of artificial domestication and human selection on the genetic differentiation of the plant and the adaptive mechanism of the plant to the plateau ecological environment.
DUAN Yuanwen
")
This data is the spatial distribution map of ecological shelters in Nursultan, the capital of Kazakhstan in 2018. The types of features in the map mainly include shelter forests, roads, buildings, lakes and rivers. The data source is four sentinel images in August 2018, with a resolution of 10 meters. At the same time, overlay the vector map of OSM global features. The data set is more accurate after correction. Through visual interpretation and field investigation, the extraction of shelter forest spot has high precision. The data reflects the spatial distribution of urban ecological shelters in Nursultan, the capital of Kazakhstan. At the same time, it has an important reference value for the long-term monitoring of the spatial and temporal pattern of shelter forests.
WANG Yongdong
")
By archaeological investigation and excavation in Tibetan Plateau and Hexi corridor, we discovered more than 40 Neolithic and Bronze Age sites, including Zongri, Sanjiaocheng, Huoshiliang, Ganggangwa, Yigediwonan, Shaguoliang, Guandi, Maolinshan, Dongjicuona, Nuomuhong, Qugong, Liding and so on. In this dataset, there are some basic informations about these sites, such as location, longitude, latitude, altitude, material culture and so on. On this Basis, we identified animal remains, plant fossil, selected some samples for radiocarbon dating, optically stimulated luminescence dating, stable carbon, nitrogen isotopes, polle, fungal sporen and environmental proxies. This dataset provide important basic data for understanding when and how prehistoric human lived in the Tibetan Plateau during the Neolithic and Bronze Age.
YANG Xiaoyan, Lü Hongliang, LIU Xiangjun, HOU Guangliang

The data set includes the spatial distribution of grass yield in the Qinghai-Tibetan Plateau in 1980, 1990, 2000, 2010, and 2017. The gross primary productivity (GPP) of grassland in the Qinghai-Tibetan Plateau was simulated based on the ecological hydrological dynamic model VIP (vegetation interface process) with independent intellectual property of Institute of Geographical Sciences and Natural Resources Research, Chinese Academy of Sciences. The net primary productivity (NPP) was estimated by empirical coefficient, and converted it into dry matter, and then the hay yield was estimated by root-shoot ratio. The spatial resolution is 1km. The data set will provide the basis for grassland resource management, development, utilization and the formulation of the strategy of "grass for livestock".
MO Xingguo

This dataset subsumes sustainable livestock carrying capacity in 2000, 2010, and 2018 and overgrazing rate in 1980, 1990, 2000, 2010, and 2017 at county level over Qinghai Tibet Plateau. Based on the NPP data simulated by VIP (vehicle interface process), an eco hydrological model with independent intellectual property of the institute of geographic sciences and nature resources research(IGSNRR), Chinese academy of Sciences(CAS), the grass yield data (1km resolution) is obtained. Grass yield is then calculated at county level, and corresponding sustainable livestock carring capacity is calculated according to the sustainable livestock capacity calculation standard of China(NY / T 635-2015). Overgrazing rate is calculated based on actual livestock carring capacity at county level.The dataset will provide reference for grassland restoration, management and utilization strategies.
MO Xingguo

According to the characteristics of the Qinghai Tibet Plateau and the principles of scientificity, systematization, integrity, operability, measurability, conciseness and independence, the human activity intensity evaluation index system suitable for the Qinghai Tibet Plateau has been constructed, which mainly includes the main human activities such as agricultural and animal husbandry activities, industrial and mining development, urbanization development, tourism activities, major ecological engineering construction, pollutant discharge, etc, On the basis of remote sensing data, ground observation data, meteorological data and social statistical yearbook data, the positive and negative effects of human activities are quantitatively evaluated by AHP, and the intensity and change characteristics of human activities are comprehensively evaluated. The data can not only help to enhance the understanding of the role of human activities in the vegetation change in the sensitive areas of global change, but also provide theoretical basis for the sustainable development of social economy in the Qinghai Tibet Plateau, and provide scientific basis for protecting the ecological environment of the plateau and building a national ecological security barrier.
ZHANG Haiyan, XIN Liangjie, FAN Jiangwen, YUAN Xiu

The dataset is the ground verification point dataset of land cover and vegetation type in the Source Region of the Yangtze River (in the south of Qinghai Province) which collected during August 2018. In the dataset, the homogeneous patches are considered as the main targets of this collection. They are easy to be recognized out and distinguished from other vegetation types. And these samples have high representativeness comparing with other land surface features. In each sample, the geographical references, longitude and latitude (degree, minute, second), time (24h) and elevation (0.1m) are recorded firstly according to GPS positioning. Vegetation types, constructive species, characteristics, land types and features, landmarks, etc. are recorded into the property table manually for checking in laboratory. At last, each sample place has been taken at least 1 photography. In this dataset, 90% or more samples have been taken 2 or more in field landscape photographs for land use type and vegetation classification examination. We have carefully examined the position accuracy of each sample in Google Earth. After 2 rounds of checking and examination, the accuracy and reliability of the property of each sample have been guaranteed.
WANG Xufeng

The dataset is the ground verification point dataset of land cover and vegetation type in the Source Region of Yellow River (in the north of Zaling Lake, Qinghai Province) which collected during August 2018. In the dataset, the homogeneous patches are considered as the main targets of this collection. They are easy to be recognized out and distinguished from other vegetation types. And these samples have high representativeness comparing with other land surface features. In each sample, the geographical references, longitude and latitude (degree, minute, second), time (24h) and elevation (0.1m) are recorded firstly according to GPS positioning. Vegetation types, constructive species, characteristics, land types and features, landmarks, etc. are recorded into the property table manually for checking in laboratory. At last, each sample place has been taken at least 1 photography. In this dataset, 90% or more samples have been taken 2 or more in field landscape photographs for land use type and vegetation classification examination. We have carefully examined the position accuracy of each sample in Google Earth. After 2 rounds of checking and examination, the accuracy and reliability of the property of each sample have been guaranteed.
WANG Xufeng

The dataset is the ground verification point dataset of land cover and vegetation type in the Hoh Xil (in the northwest of Qinghai Province) which collected during August 2018. In the dataset, the homogeneous patches are considered as the main targets of this collection. They are easy to be recognized out and distinguished from other vegetation types. And these samples have high representativeness comparing with other land surface features. In each sample, the geographical references, longitude and latitude (degree, minute, second), time (24h) and elevation (0.1m) are recorded firstly according to GPS positioning. Vegetation types, constructive species, characteristics, land types and features, landmarks, etc. are recorded into the property table manually for checking in laboratory. At last, each sample place has been taken at least 1 photography. In this dataset, 90% or more samples have been taken 2 or more in field landscape photographs for land use type and vegetation classification examination. We have carefully examined the position accuracy of each sample in Google Earth. After 2 rounds of checking and examination, the accuracy and reliability of the property of each sample have been guaranteed.
WANG Xufeng
")
According to the method of dendrology, tree cores of Schrenk spruce (Picea schrenkiana) in central (Houxia, Urumqi) and western Tianshan Mountains (kuruning, Yili) were collected. Through the traditional method of dendrology, the sample was processed and dated according prescriptive process. We established the width chronology of Schrenk spruce (Picea schrenkiana) in central and western Tianshan Mountains. As the method of tree ring isotope, four tree cores were selected. After cleaning and air-dried, tree rings were separated five-year increments suing a scalpel under a microscope. Hg concentrations were analyzed in duplicate following the established procedures on a Leeman Hydra IIC Direct Hg Analyzer (Teledyne Leeman Labs, Hudson, NH, USA). The principle of the analytical method is cold vapor atomic absorption spectrometer after thermal decomposition and amalgamation of a gold trap following the US EPA method 7473 (USEPA 1998). The enhanced Hg pollution, especially at low-frequency, was revealed, which was consistent with the changes of global Hg deposition. In central Tianshan Mountains, Hg values showed strong anthropogenic impacts and reflected the local Hg emission loading. Compared to the ice-core Hg records on the Tibet Plateau, our outcomes presented the dramatic increasing trend after the World War Ⅱ. We suggested that tree rings in remote area can be employed to reflect the low-frequency and large-scale Hg deposition and can benefit to accurate the Hg emission inventory in China.
LIU Xiaohong

By archaeological investigation and excavation in Tibetan Plateau, we discovered 8 Paleolithic sites, including 151, Jiangxigou 1, Jiangxigou 2, Heimahe 1, Xiadawu, Yezere, Niamudi and Lingjiong. In this dataset, there are some basic informations about these sites, such as location, longitude, latitude, altitude, material culture and so on. On this Basis, we identified animal remains, plant macrofossil, selected some samples for radiocarbon dating and stable carbon and nitrogen isotopes. This dataset provide important basic data for understanding when and how prehistoric human lived in the Tibetan Plateau during the Paleolithic.
ZHANG Dongju , ZHANG Xiaoling, LIU Xiangjun
")
By archaeological investigation and excavation in Tibetan Plateau, we discovered 14 historic period sites, including Meinuo, Sariguo, Rongwaguo, Kaze, Jiha, Yarigei, Bami, Barongbadang, Qingtu, Labu ,Maisong Petroglyph, Gala, Yezere 1 and Yezere 4 . In this dataset, there are some basic informations about these sites, such as location, longitude, latitude, altitude, material culture and so on. On this Basis, we identified animal remains, plant macrofossil, selected some samples for radiocarbon dating and stable carbon and nitrogen isotopes. This dataset provide important basic data for understanding when and how prehistoric human lived in the Tibetan Plateau during the historic period.
DONG Guanghui , HOU Guangliang

In order to explore how and when turnip was successfully domesticated the Qinghai-Tibet Plateau and what is the relationship between turnip domestication and early human settlement on the Qinghai-Tibetan Plateau and human migration along the ancient Silk Road, the whole genome De Novo sequencing of a self-bred F1 variety on Qinghai-Xizang Plateau was conducted, with the assembled genome size of 409.69 Mb,Contig N50 was 1.21 Mb in June 2018 using Pacbio sequencing. Those data will provide a genetic basis for elucidating the relationship between plant disperse and human activities. As we know, traditional turnip landrace is influenced by human domestication and nature selection. Hopefully, the study will help to understand the impacts of human selection on turnip genetic differentiation, and the adaptation mechanism of turnip in the Qinghai-Tibetan Plateau.
DUAN Yuanwen

By archaeological investigation and excavation in Tibetan Plateau, we discovered 8 Neolithic and Bronze Age sites, including Gaomuxudi, Duojialiang, Shuikou, Qipanshan, Xinzhai, Canxionggasu, Niaodao, Bangga, Baiyangcun and so on. In this dataset, there are some basic informations about these sites, such as location, longitude, latitude, altitude, material culture and so on. On this Basis, we identified animal remains, plant macrofossil, selected some samples for radiocarbon dating and stable carbon and nitrogen isotopes. This dataset provide important basic data for understanding when and how prehistoric human lived in the Tibetan Plateau during the Neolithic and Bronze Age.
DONG Guanghui , YANG Xiaoyan, Lü Hongliang
")
This data set contains the results of the calculation of Net Primary Productivity (NPP) on the Tibetan Plateau based on ecological models and remote sensing data from 1982 to 2006. Ecosystem NPP of the Tibetan Plateau was generated based on the remote sensing Advanced Very High Resolution Radiometer (AVHRR) data and the Carnegie-Ames-Stanford Approach (CASA) model(1982-2006), the soil carbon content was generated based on the second soil census data, and the biomass carbon data were generated based on the High Resolution Biosphere Model (HRBM) model. Forest ecosystem NPP of the Tibetan Plateau (1982-2006): npp_forest82.e00,npp_forest83.e00,npp_forest84.e00,npp_forest85.e00,npp_forest86.e00, npp_forest87.e00,npp_forest88.e00,npp_forest89.e00,npp_forest90.e00,npp_forest91.e00, npp_forest92.e00,npp_forest93.e00,npp_forest94.e00,npp_forest95.e00,npp_forest96.e00, npp_forest97.e00,npp_forest98.e00,npp_forest99.e00,npp_forest00.e00,npp_forest01.e00, npp_forest02.e00,npp_forest03.e00,npp_forest04.e00,npp_forest05.e00,npp_forest06.e00 Grassland ecosystem NPP of the Tibetan Plateau(1982-2006): npp_grass82.e00,npp_grass83.e00,npp_grass84.e00,npp_grass85.e00,npp_grass86.e00, npp_grass87.e00,npp_grass88.e00,npp_grass89.e00,npp_grass90.e00,npp_grass91.e00, npp_grass92.e00,npp_grass93.e00,npp_grass94.e00,npp_grass95.e00,npp_grass96.e00, npp_grass97.e00,npp_grass98.e00,npp_grass99.e00,npp_grass00.e00,npp_grass01.e00,npp_grass02.e00,npp_grass03.e00,npp_grass04.e00,npp_grass05.e00,npp_grass06.e00. Biomass carbon and soil carbon of the Tibetan Plateau: Biomass.e00,Socd.e00. The soil carbon content data (Socd) are generated based on data of the second soil census of China and Soil Map of China (1:1,000,000) by soil subclass interpolation. The NPP data are generated from the CASA model and AVHRR data simulation: Potter CS, Randerson JT, Field CB et al. Terrestrial ecosystem production: a process model based on global satellite and surface data. Global Biogeochemical Cycles, 1993, 7: 811–841. The biomass carbon data are generated via HRBM model simulation: McGuire AD, Sitch S, et al. Carbon balance of the terrestrial biosphere in the twentieth century: Analyses of CO2, climate and land use effects with four process-based ecosystem models. Global Biogeochem. Cycles, 2001, 15 (1), 183-206. The raw data are mainly remote sensing data and field observation data with high accuracy; the verification and adjustment of the measured data in the field during the production were undertaken to maintain the error of the simulation results and the field measured data within the acceptable range as much as possible; the verification results of the NPP data and the field measured data show that the error remains within 15%. The spatial resolution is 0.05°×0.05° (longitude×latitude).
ZHOU Caiping

The data set include crop leaf stomatal conductance observed at four sample regions, that is the soil moisture control experimental field at Daman county, and the super station, and Shiqiao sample plots at Wuxing village in Zhangye city. 1) Objective Crop leaf stomatal conductance, a key biophysical parameter, was observed as model parameter or a priori knowledge for crop growth model, or evapotranspiration estimation. 2) Measuring instruments Leaf porometer. 3) Measuring site a. the soil moisture control experimental field at Daman county, Twelve soil water treatments are set. The crop leaf stomatal conductance for each treatment is measured on 17, 23 and 29 May, and 3, 9, 14 and 24 June, and 5 and 12 July. b. the Super Station The crop leaf stomatal conductance at the super station is measured on 22 and 28 May, 5, 11, 18, and 25 June, and 1, 8, 15, 22 and 31 July, 9, 15 and 22 August, and 3 and 11 September. c. the Shiqiao sample site The crop leaf stomatal conductance at the Shiqiao village is measured on 17, 22 and 28 May, 4, 11, 17 and 25 June, 1, 8, 15, 22, and 30 July, 8, 16 and 27 August, and 9 September. 4) Data processing The observational data was recorded in the sheets and reorganized in the EXCEL sheets. The time used in this dataset is in UTC+8 Time.
Xu Fengying, Wang Jing, Huang Yongsheng, LI Xin, MA Mingguo
")
1) Initial data of community characteristics and main plant biological characteristics of the grass-animal equilibrium stage of the test grassland in 1983; 2) Livestock management data of 4-5 grazing grasslands; 3) Observation data of diversity, productivity and functional group of different grazing grassland communities; 4) Observation data on the height, coverage, biomass, and flower morphology, tillering, and leaf characteristics of main plants in different grazing gradient grasslands 5) Observation data of soil nutrients and litter in different grazing grasslands.
ZHAO Chengzhang
")
Correlation data of vegetation functional traits with topographic factors and pastoral animal husbandry activity factors, including: 1) observation data of main functional traits of 2-3 kinds of grassland plants in elevation, slope and slope upward; 2) correlation analysis data of vegetation functional traits and topographic factors; 3) correlation analysis data between vegetation functional traits and livestock activity intensity factors.
ZHAO Chengzhang
")
This data set is collected according to the output results of tesim ecological process model, including biomass, plant N and P content, evapotranspiration, NPP and other model output results. Some of the results are obtained by field measurement, some by laboratory analysis of field samples, some by literature.
PENG Hongchun
")
China 1:100000 data of land use is a major application in the Chinese Academy of Sciences "five-year" project "the national resources and environment remote sensing macroscopic investigation and study of dynamic organized 19 Chinese Academy of Sciences institute of remote sensing science and technology team, by means of satellite remote sensing, in three years based on Landsat MSS, TM and ETM remote sensing data established China 1:100000 images and vector of land use database.The main contents include: China 1:100,000 land use data;China 1:100,000 land use graph data and attribute data. The data was directly clipped from China's 1:100,000 land-use data.A hierarchical land cover classification system was adopted for the land use data of heihe basin of 1:100,000, and the whole basin was divided into 6 primary categories (arable land, forest land, grassland, water area, urban and rural areas, industrial and mining areas, residential land and unused land) and 26 secondary categories.The data type is vector polygon, which is stored in Shape format.There are two types of data projection: WGS84/ALBERS;Data coverage covers the new heihe watershed boundary (lack of outer Mongolia data). Land use classification attributes: The first class type and the second class type attributes encode the spatial distribution position Cultivated paddy field 113 is mainly distributed in alluvial plain, basin and valley Cultivated paddy field 112 distributed in hilly valley narrow valley platform or beach (with irrigation conditions) Cultivated paddy field 111 is mainly distributed in mountain valley narrow valley platform or beach (with better irrigation conditions) Arable land 124 is mainly distributed in mountainous areas, the slope is generally more than 25 degrees (belongs to the steep slope hanging land), should be returned to forest. Cultivated dry land 123 is mainly distributed in basins, piedmont belts, river alluvial, diluvial or lacustrine plains (water shortage and poor irrigation conditions). Cultivated dry land 122 is mainly distributed in hilly areas (shaanxi, gan, ning, qing).In general, the plot is distributed on gentle slopes and x and sockets of hills. Arable land 121 is mainly distributed in the mountainous area, with an elevation of 4000 meters below the slope (gentle slope, mountainside, steep slope platform, etc.) and mountain front belt. Woodlands have woodlands (trees) 21 mainly distributed in the mountains (below 4000 meters above sea level) or in the slope, valley two slopes, mountain tops, plains.In qinghai nanshan, qilian mountains are. Woodland shrub 22 is mainly distributed in the higher mountain areas (below 4500 m), most of the distribution of hillside and valley and sand. Forest dredging 23 mainly distributed in the mountains, hills, plains and sandy land, gobi (soil, gravel) edge. Other woodlands 24 are mainly distributed in the oasis ridge, river, roadside and rural residential areas around. Grassland 31 is generally distributed in mountainous areas (gentle slopes), hills (steep slopes) and interriver beaches, gobi desert, sandy hills, etc. The covered grassland 32 is mainly distributed in dry places (next door low-lying land and sandy hills, etc.). Grassland low cover grassland 33 mainly grows in drier places (loess hills and sandy edges). The river channel 41 is mainly distributed in the plain, the cultivated land between the rivers and the valleys in the mountains. Water lakes are mainly distributed in low-lying areas. The reservoirs are mainly distributed in the intermountain lowlands and intersandy hills in qinghai province. Water area glaciers and permanent snow 44 mainly distributed in the plain, the valley between the river, there are surrounding residents and arable land. Waters and beaches are mainly distributed on the top of (over 4000) mountains.
WANG Jianhua, LIU Jiyuan
Contact Support
Links
National Tibetan Plateau Data CenterFollow Us

A Big Earth Data Platform for Three Poles © 2018-2020 No.05000491 | All Rights Reserved
|  No.11010502040845
Tech Support: westdc.cn